
What your money really buys.
Prices rose 70% from 2005 to 2025. A dollar kept as cash lost 41% of its buying power. Here is what kept up.
- $1.002005
- $0.882009
- $0.802015
- $0.732020
- $0.592025
What $10,000 from 2005 buys at the end of 2025
In 2005 dollars, so you can compare it with what you put in. Before fees and taxes.
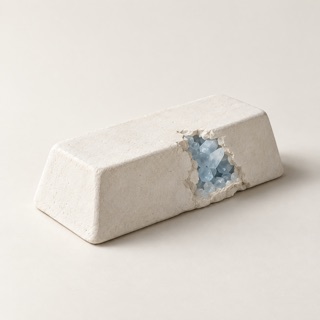 GoldGold price. Fixed by law until 1971$58,504+8.8% a year$99,624 in dollars
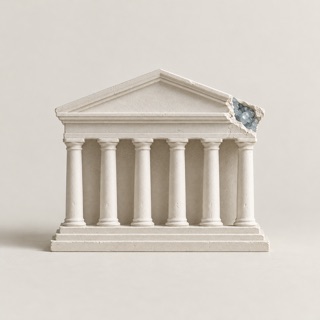 S&P 500500 large US companies, dividends reinvested$48,762+7.8% a year$83,034 in dollars
 Corporate bondsBonds of US companies (Baa rated)$17,419+2.7% a year$29,662 in dollars
 US homesHome prices only, no rent or costs$12,156+0.9% a year$20,699 in dollars
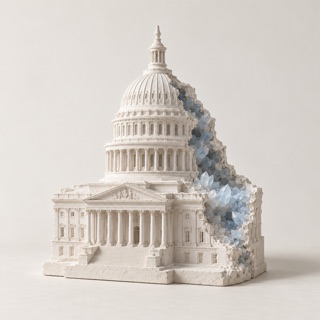 10-year TreasuryUS government bonds$10,464+0.2% a year$17,818 in dollars
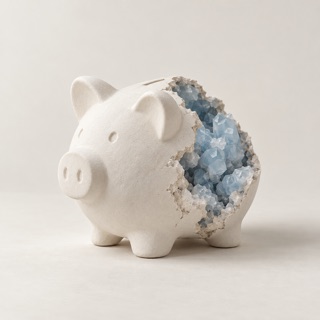 Savings3-month Treasury bills, like a savings account$8,446−0.8% a year$14,382 in dollars
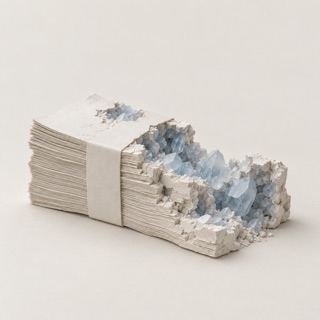 CashDollar bills that earn nothing$5,872−2.5% a year$10,000 in dollars
Buying power over time
In 2005 dollars. The dashed line is $10,000: above it, your money buys more than at the start.
How it works
Buying power. We take the value of your money at the end and remove the price rise since the start. What is left is what it can buy, in start-year dollars.
The art. Each asset is shown as a plaster cast that erodes into blue crystal, like a relic from the future: what time and inflation do to money.
The data. Yearly total returns from Aswath Damodaran (NYU Stern). Inflation is US CPI, December to December. No fees or taxes.
Data 1928 to 2025 · Damodaran · CPI (FRED) · Download data · Source
For education only. Not investment advice. Past returns do not predict future returns.